

Between the 10th and 15th of July, our team participated in the NWG Innovation Festival. It was a genuinely fun experience - hackathon type event. And how could it not be, Northumbrian Water Group has made every effort to make it that way, including setting up the Funder Dome, and bringing Dwaine Pipe along for the ride. More importantly, though, aside from it being fun, it was also very informative and useful. They decided to tackle several problems, splitting it out into multiple sprints, and Microsoft was sponsoring one of these sprints relating to water leakage. Our team decided to use Big Data and Machine Learning (buzzword bingo!) to see if we can help them.
Water Leakage?
It may not seem like it, but it turns out water leakage is a massive problem for water companies. They are spending a ton of money trying to find the leaks, which, as it turns out, isn't as easy as it sounds. Most of the leaks are actually background leakage. There's a (honestly) fascinating video series from NWG's Dennis Dellow. Not only are these leaks clearly affected by many things, like soil types, joint types between the pipes, the material the pipes are made of themselves, even the traffic conditions above the pipe - it turns out a vast majority of the water infrastructure is laid out under roads; it makes sense, as that makes it easier to maintain.
In addition to all the factors above, there is one big problem - cost. Fixing big bursts is "easy" and relatively quick. After all, you can see a mountain of water coming out of somewhere. Fixing the small ones, however, that seep a small amount of water for a long time, is expensive because it's hard to track them down. In fact, companies exist that specialise in providing equipment to detect these leaks.
Data, glorious data
We all know, data is becoming more and more important. Big data is a buzzword, but it's also reality. Companies are starting to store more and more data, because at one point, it might become valuable. I covered some interesting ways to "use" our "data", which is in the forms of photos and EXIF metadata, to draw food I've eaten on a map. Not exactly the world saving tool we need, but it's the one I have :-).
Coming back to the water leakage problem... The CSE (Commercial Software Engineering, formerly known as Developer eXperience) team that attended the festival consisted of experts in Machine Learning, Cognitive Services, and myself. Being new to this world of high-scale data, I figured I'd take this opportunity to learn.
Understanding the data
NWG were kind enough to provide us with a lot of data. This data consists of stuff like flow and pressure data for 3 years, in 15 minute intervals, weather, traffic and soil data, etc. Most of it is a trade secret, so I won't go into detail about it - it's also not relevant for this post. The bit that was interesting for me, was trying to figure out how to see the data and try to discern a pattern from it.
There was an interesting product that launched fairly recently - Azure Time Series Insights. So, what is it? The blog post says it is:
A fully managed analytics, storage, and visualization service that makes it incredibly simple to interactively and instantly explore and analyze billions of events from sources such as Internet of Things
That sounds (and looks) like something I need!
It integrates nicely with Azure Event Hubs which means I could potentially use it to ingest a lot of data. The data I planned on using was flow data from the water network: flow measurements, taken every 15 minutes, from the years 2013 - 2016. It was in CSV format.
Ingesting the Data
To start ingesting the data, I needed to setup all the bits. In my case that meant spinning up an Event Hub and a Time Series instance. For the purpose of this hack, I opted for a Standard instance, and I experimented with setting the number of throughput units. What's a throughput unit, you ask?
Throughput units apply to all event hubs in an Event Hubs namespace, and each throughput unit entitles the namespace to the following capabilities:
- Up to 1 MB per second of ingress events (events sent into an event hub), but no more than 1000 ingress events, management operations or control API calls per second.
- Up to 2 MB per second of egress events (events consumed from an event hub).
- Up to 84 GB of event storage (sufficient for the default 24-hour retention period).
Event Hubs throughput units are billed hourly, based on the maximum number of units selected during the given hour.
Source: docs.
This is substantially more relevant when you have a LOT of devices sending lots of events simultaneously. That wasn't the case with my use-case as I had all the events in a single file, which meant I'll be sending them serially which afforded me the luxury of not caring (too much). You can also choose to let Event Hubs auto-inflate, and specify the upper limit, so if you do have a sudden spike, it's handled well.
The naive option of sending events is to follow the Getting started guide, but it turns out that's not really going as fast as I wanted. A colleague recently ran into a similar problem and wrote a piece of code that helps (a lot). Sadly, it had a few bugs at the point I needed it, so I decided to take some of the things he learnt, and try to cobble together an intermediate solution.
The EventHubClient does implement a method called SendBatch, but the keen observer will note it can throw an exception called MessageSizeExceededException. It turns out there's a limit to the message size you can send. The message size limit (at the time of writing) was 256kb, but that included the header and some padding, from what we could tell. If we look at Simon's code over here, we'll see he already takes that into account; basically he adds a padding to each event, and assumes a heading size that he established based on some conversations with Clemens Vasters and experimentation.
The relevant code is here:
        private const int MAX_EVENT_SIZE = 262144;
        private const int EVENT_PADDING_BYTES = 16;
I took the lazy approach for my code and just did this:
const double maxBatchSize = 240000;
This gives me enough space for 1.3k events in a single batch, which was enough for what I wanted. My code then, ended up looking like this (with lots of configuration, NuGets, etc. omitted):
var eventHubClient = EventHubClient.CreateFromConnectionString(eventHubConnectionString, eventHubName);


double i = 0;
List<EventData> events = new List<EventData>();
double batchByteSize = 0;
const double maxBatchSize = 240000;


foreach (var line in File.ReadLines(csvFilePath))
{
    var row = (line ?? String.Empty).Split(',');
    if (row.Length != 4)
    {
        Console.WriteLine($"Line was incorrectly formatted, aborting: {line}");
        continue;
    }


    var o = new
    {
        DMA = MassageTheData(row[0]),
        TimestampStart = ParseTimestamp(row[1]),
        TimestampEnd = ParseTimestamp(row[2]),
        AverageValue = MassageTheData(row[3]),
        Timestamp = ParseTimestamp(row[2])
    };


    // ensure the message is serializable
    var serialisedString = JsonConvert.SerializeObject(o);


    // create the Event Data using a byte array
    var b = Encoding.UTF8.GetBytes(serialisedString);
    EventData eventData = new EventData(b);


    // push the Event Data to the Event Hub
    if (batchByteSize + b.Length >= maxBatchSize)
    {
        // do send
        eventHubClient.SendBatch(events);
        events.Clear();
        batchByteSize = 0;
    }
    i++;


    events.Add(eventData);
    batchByteSize += b.Length;
}


// flush the remaining
eventHubClient.SendBatch(events);
What the code above is doing then, is taking a CSV file, parsing each line into an object I figured I could understand, transforming it into JSON, and adding it to the event batch until the batch reaches the maximum size, at which point it sends it. You'll notice there is absolutely no retry logic or anything smart in here - because I didn't need it, for prototyping. If this is something you're doing for production, there are additional considerations you need to make.
Speaking of considerations, the time stamp was a fun one. The time stamp in the CSV was specified in a weird format, so I ended up re-formatting it to something that I was sure Time Series Insights could parse:
private static string ParseTimestamp(string s)
{
    s = s.Trim();
    DateTime value;
    if (!DateTime.TryParseExact(s, "dd-MMM-yy hh.mm.ss tt", CultureInfo.InvariantCulture, DateTimeStyles.None, out value))
    {
        Console.WriteLine($"DANGER WILL ROBINSON, DANGER, cannot parse: {s}");
        s = "unknown";
        return s;
    }


    return value.ToString("yyyy-MM-ddTHH:mm:ss.FFFFFFFK");
}
I ran that console app, and after several hours I had several millions of usable events in there.
Next step was getting that data to the Time Series Insights. Getting that up and running, and ingesting from Event Hubs was AMAZINGLY easy.
Once that's done, data ingestion will start automatically, and if you follow the Go To Environment link in the Dashboard, it will take you to the front page of Time Series Insights.
This is where the fun starts. For me, this was really slow:
https://twitter.com/Avodovnik/status/885496664601100289
It turns out they're not the fastest - at least not in my use case, which may be a bit "special". I was seeing significant lag between ingesting the events and the availability of them to be analysed (hours). I'm attributing this to my usage, and am fairly sure this will be resolved soon.
Playing with the data
I had the data in Time Series, now it was time to have some fun with it. When I opened the environment, I was greeted with a nice view of the number of events ingested (and parsed):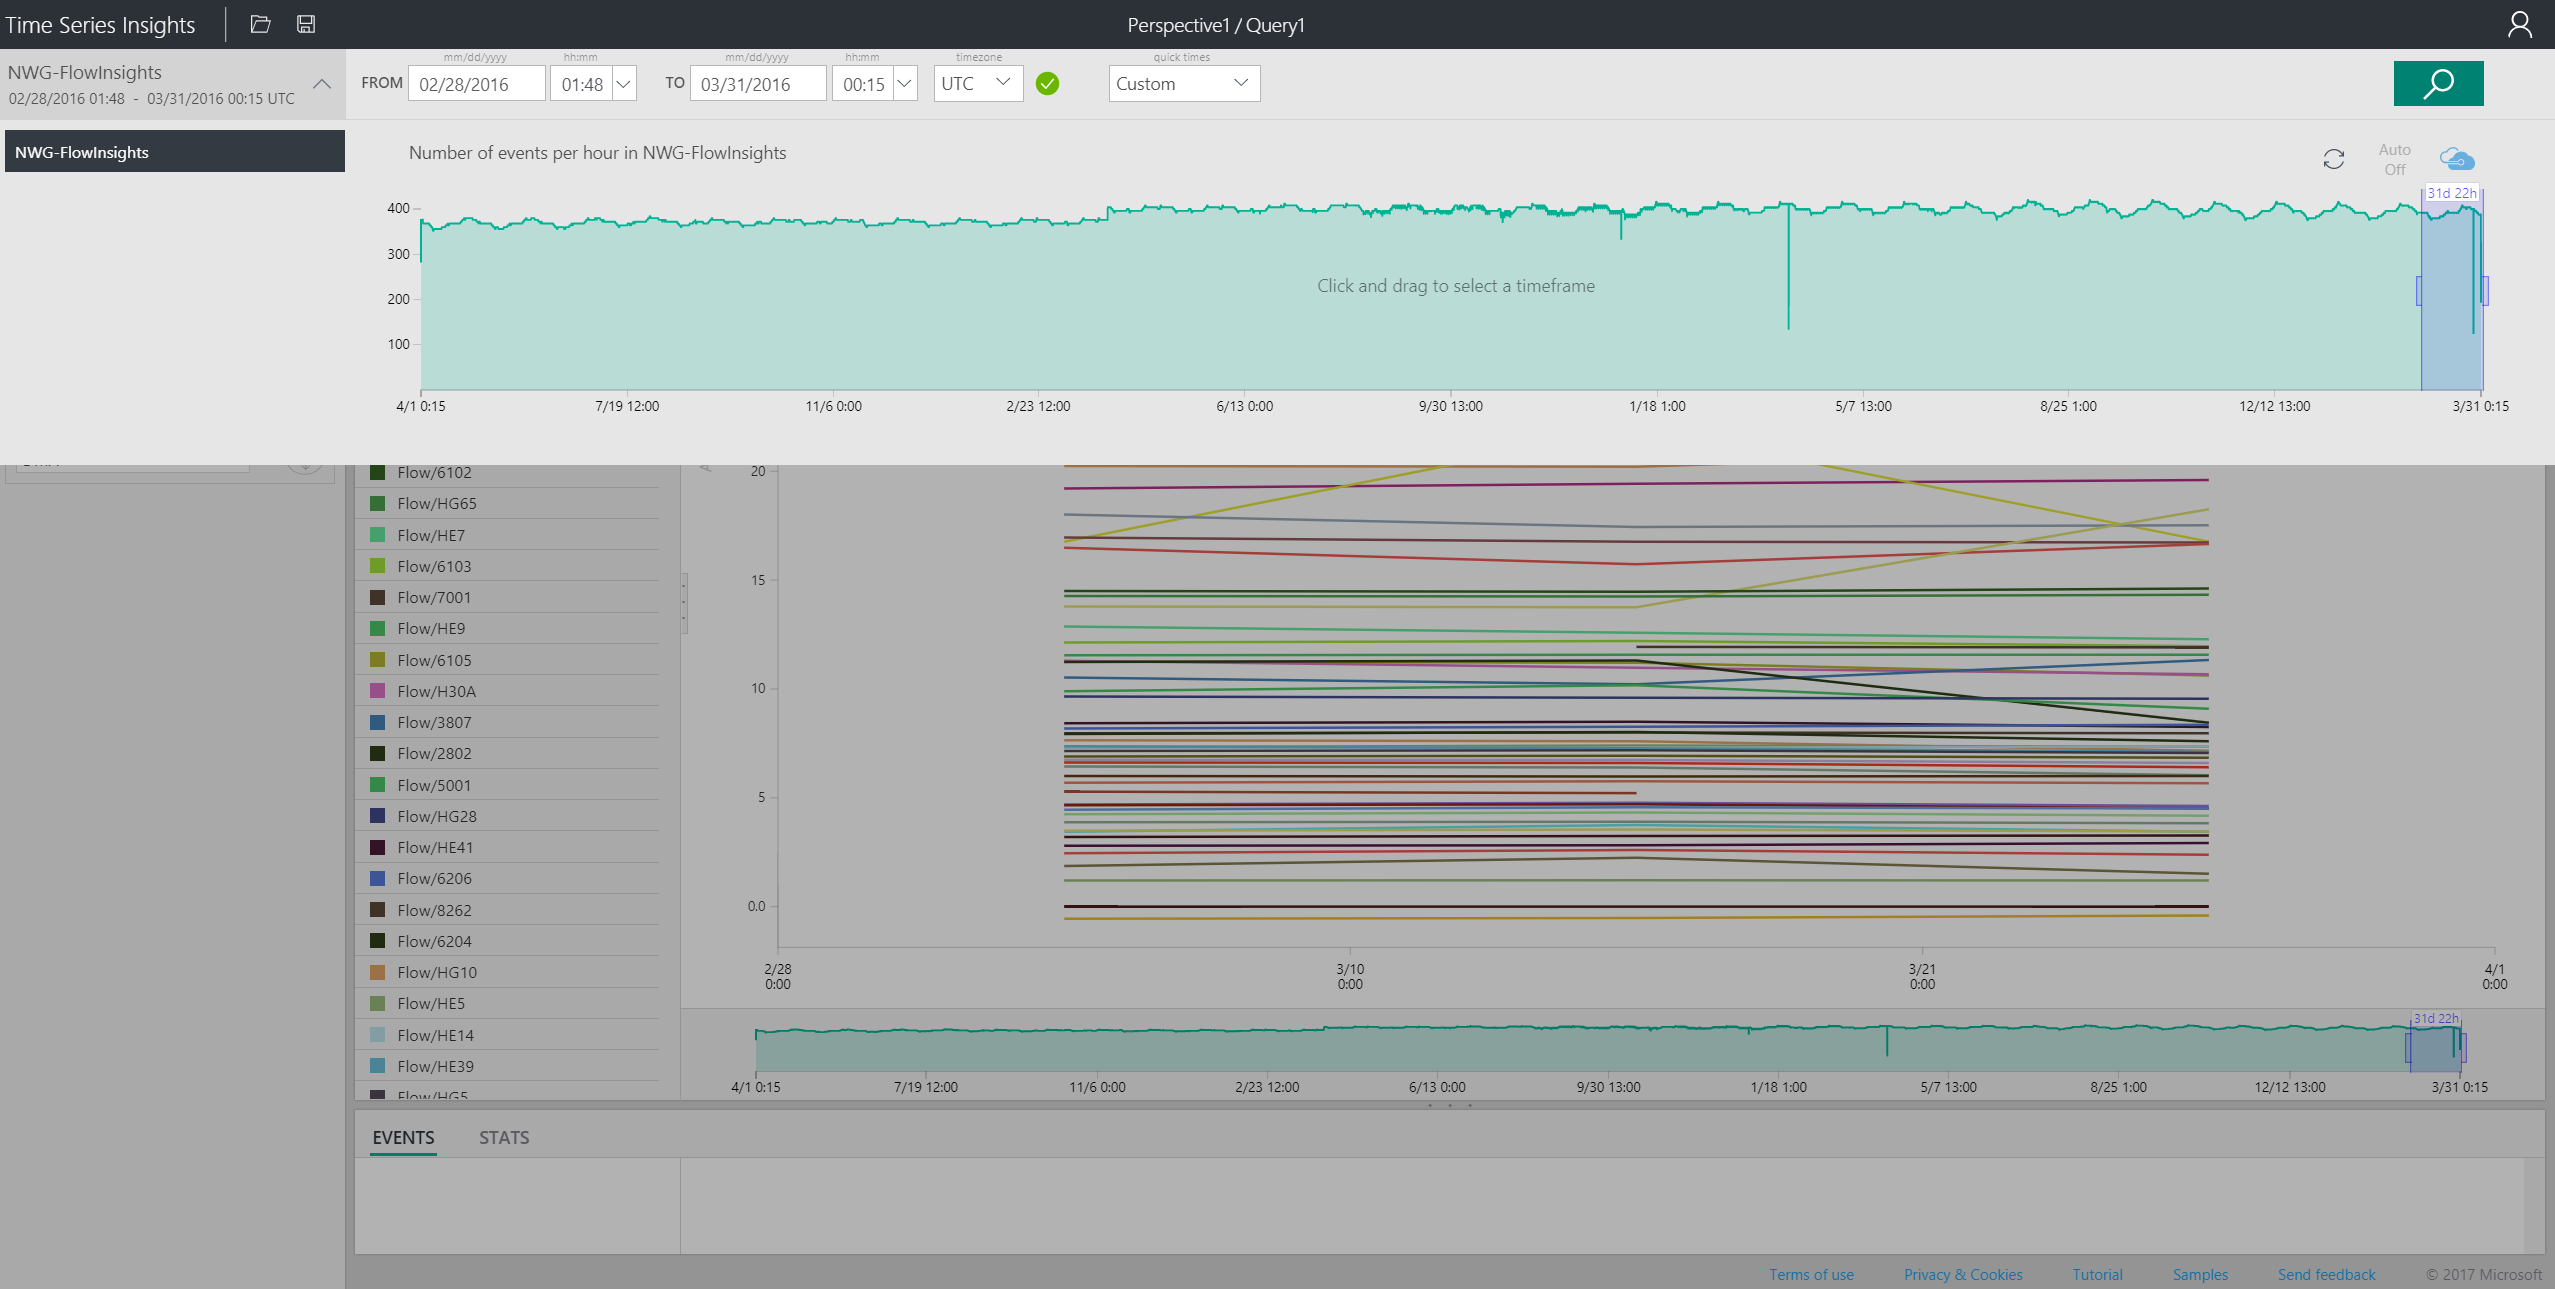
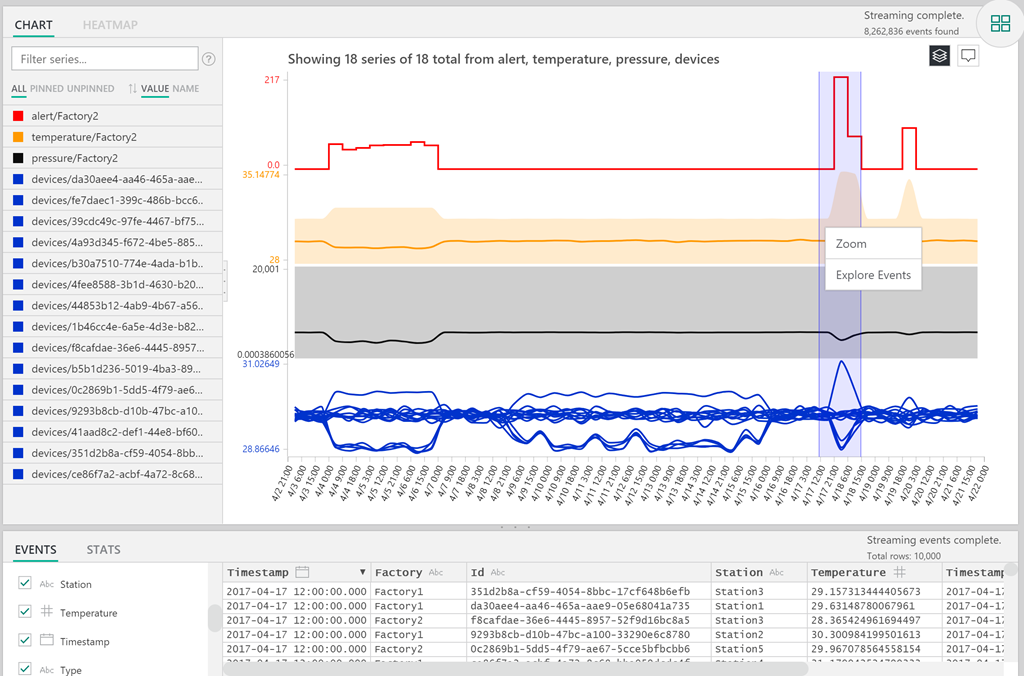
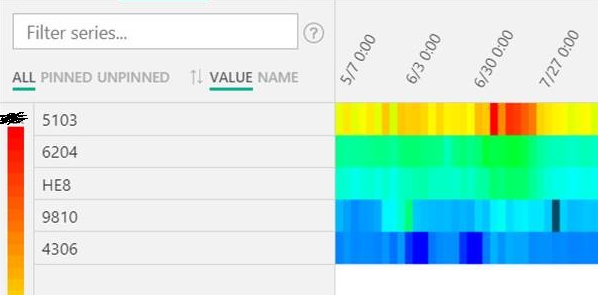
From there, I selected a small segment of data and had a look. I knew the data coming will only be interesting if I split it by the location (called DMA - or a District Meter Area). Bear in mind that Time Series Insights parsed the schema and figured the fields out itself.
This meant I could just simply select "AverageValue" which came from the data and in the drop down with the Split by selected DMA, which also comes from our data.
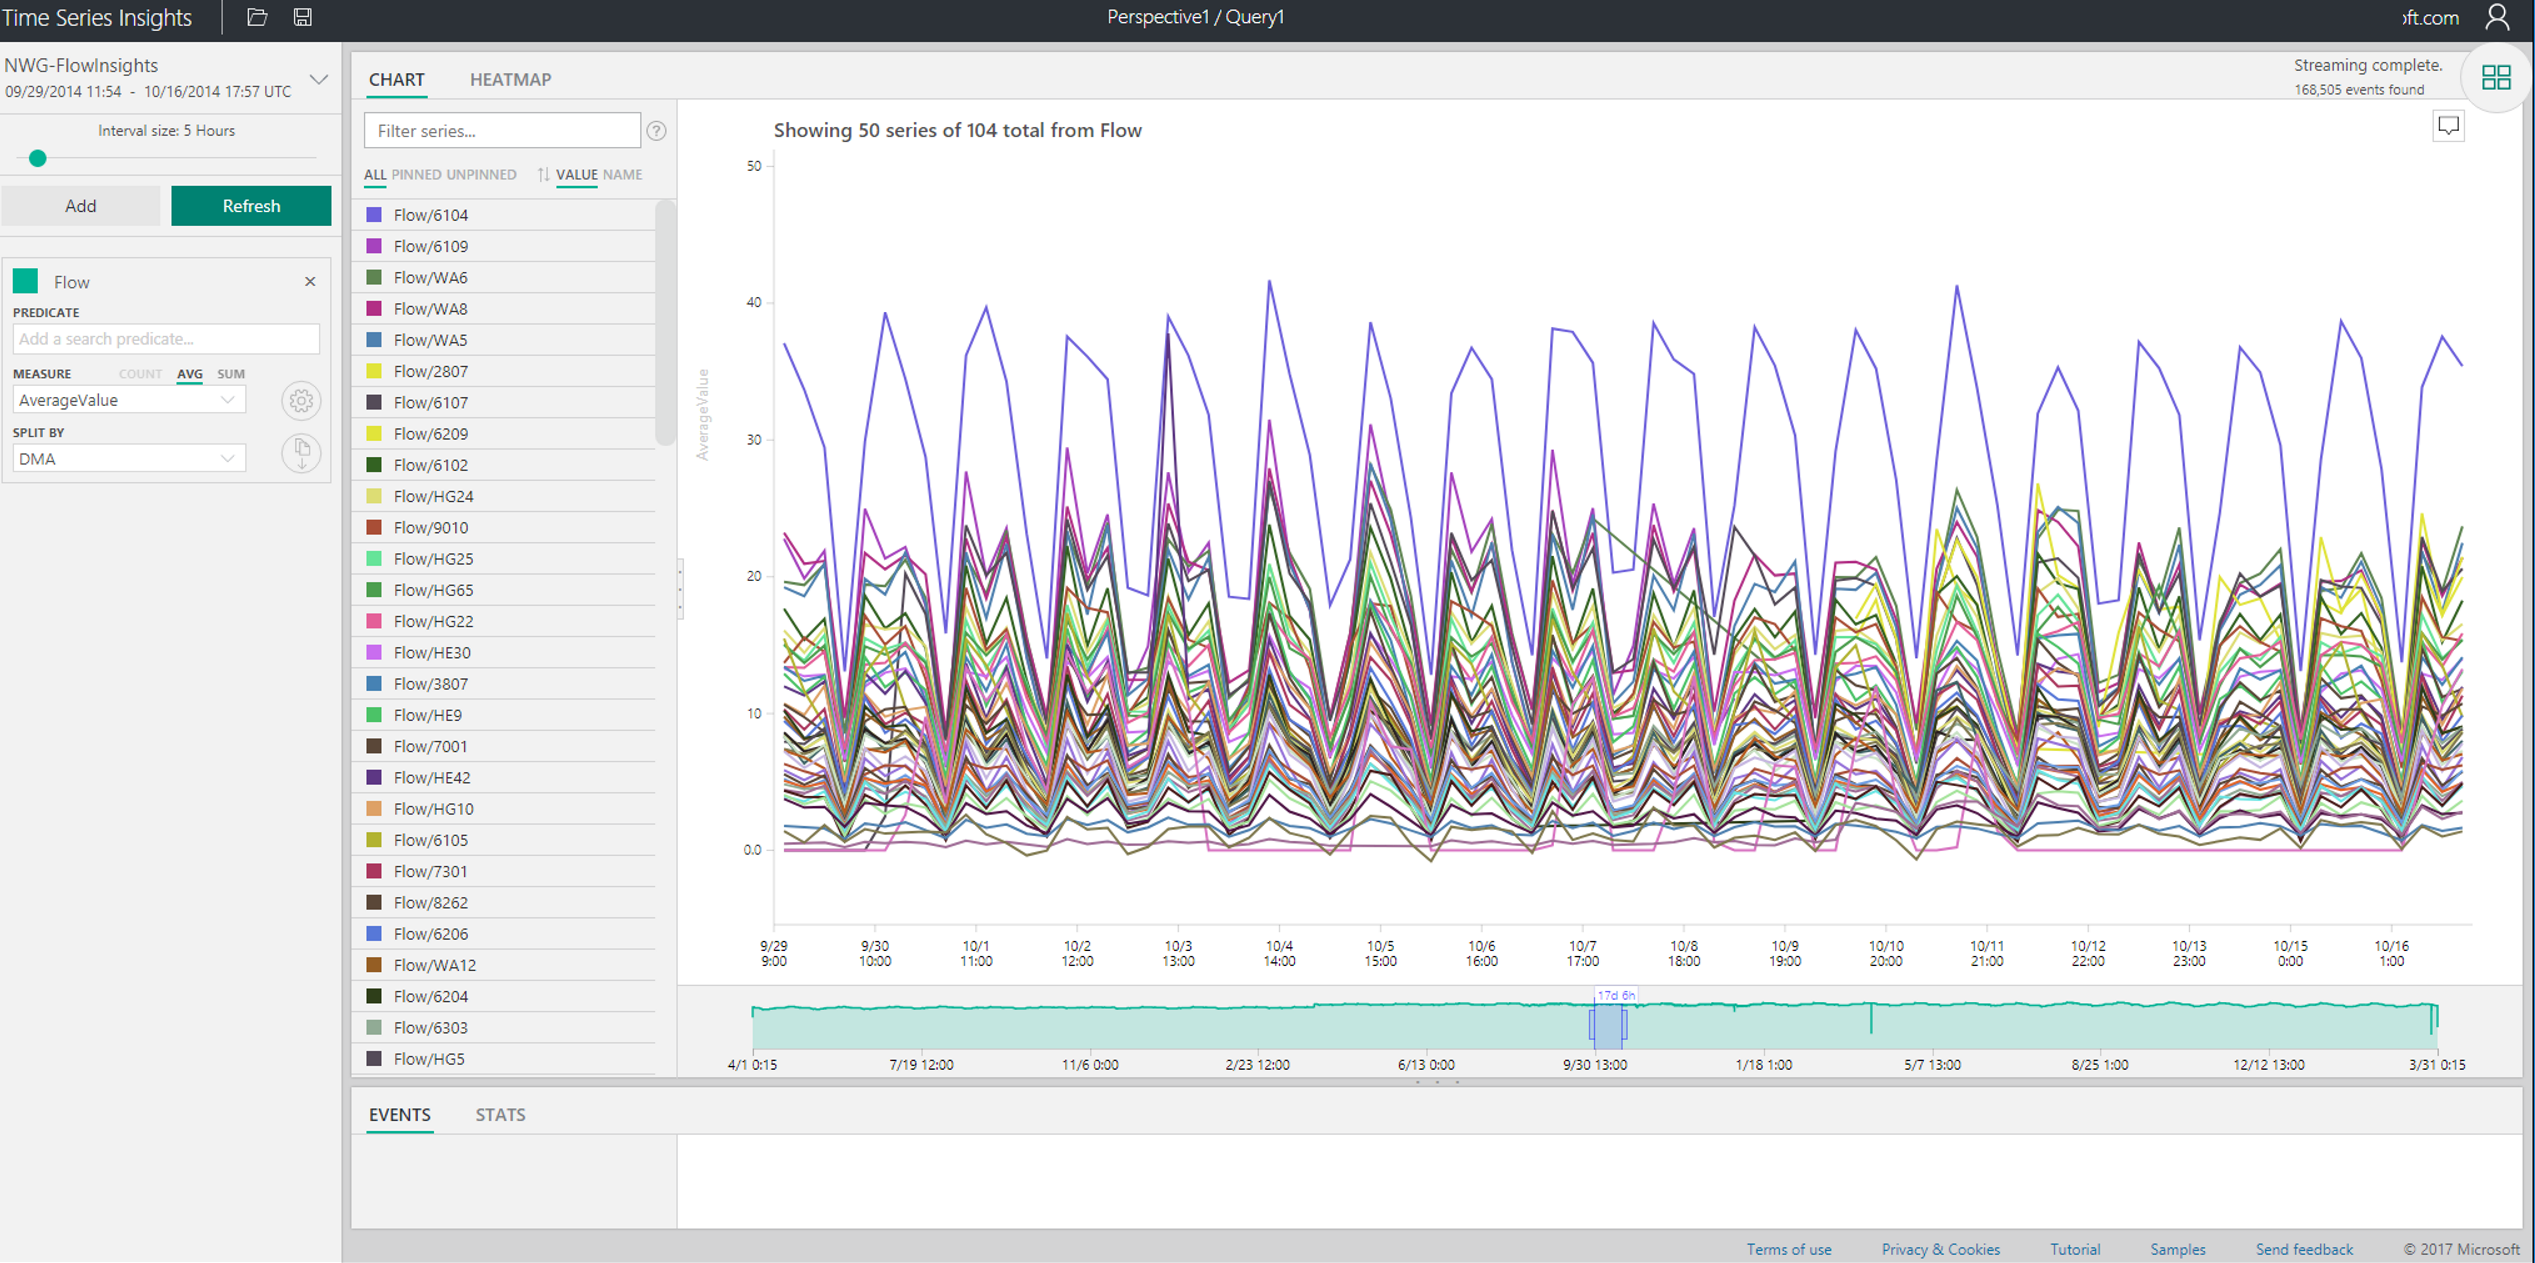
OK, that looks interesting, but it's unlikely it would tell me anything special in this particular case. That said, if this was a different use case, like for example the number of outputs per assembly line, I could easily spot a dip if I looked at the chart. Bear in mind, I'm skipping the general introduction on filtering, and drilling down in the product. The best way to learn more about that is to simply spin it up and run the demo environment. To do that, open this: https://insights.timeseries.azure.com/demo.
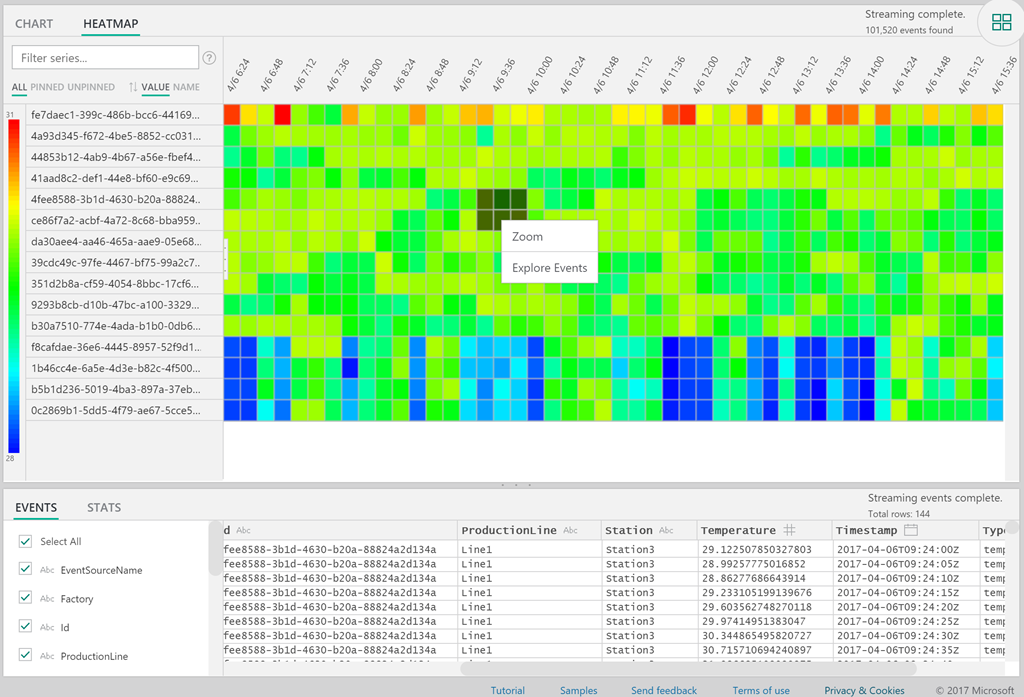
Anyway, since the data represents flow numbers, I assumed I might spot the anomalies differently - with a handy view that Time Series gives us. So I switched to Heatmap:
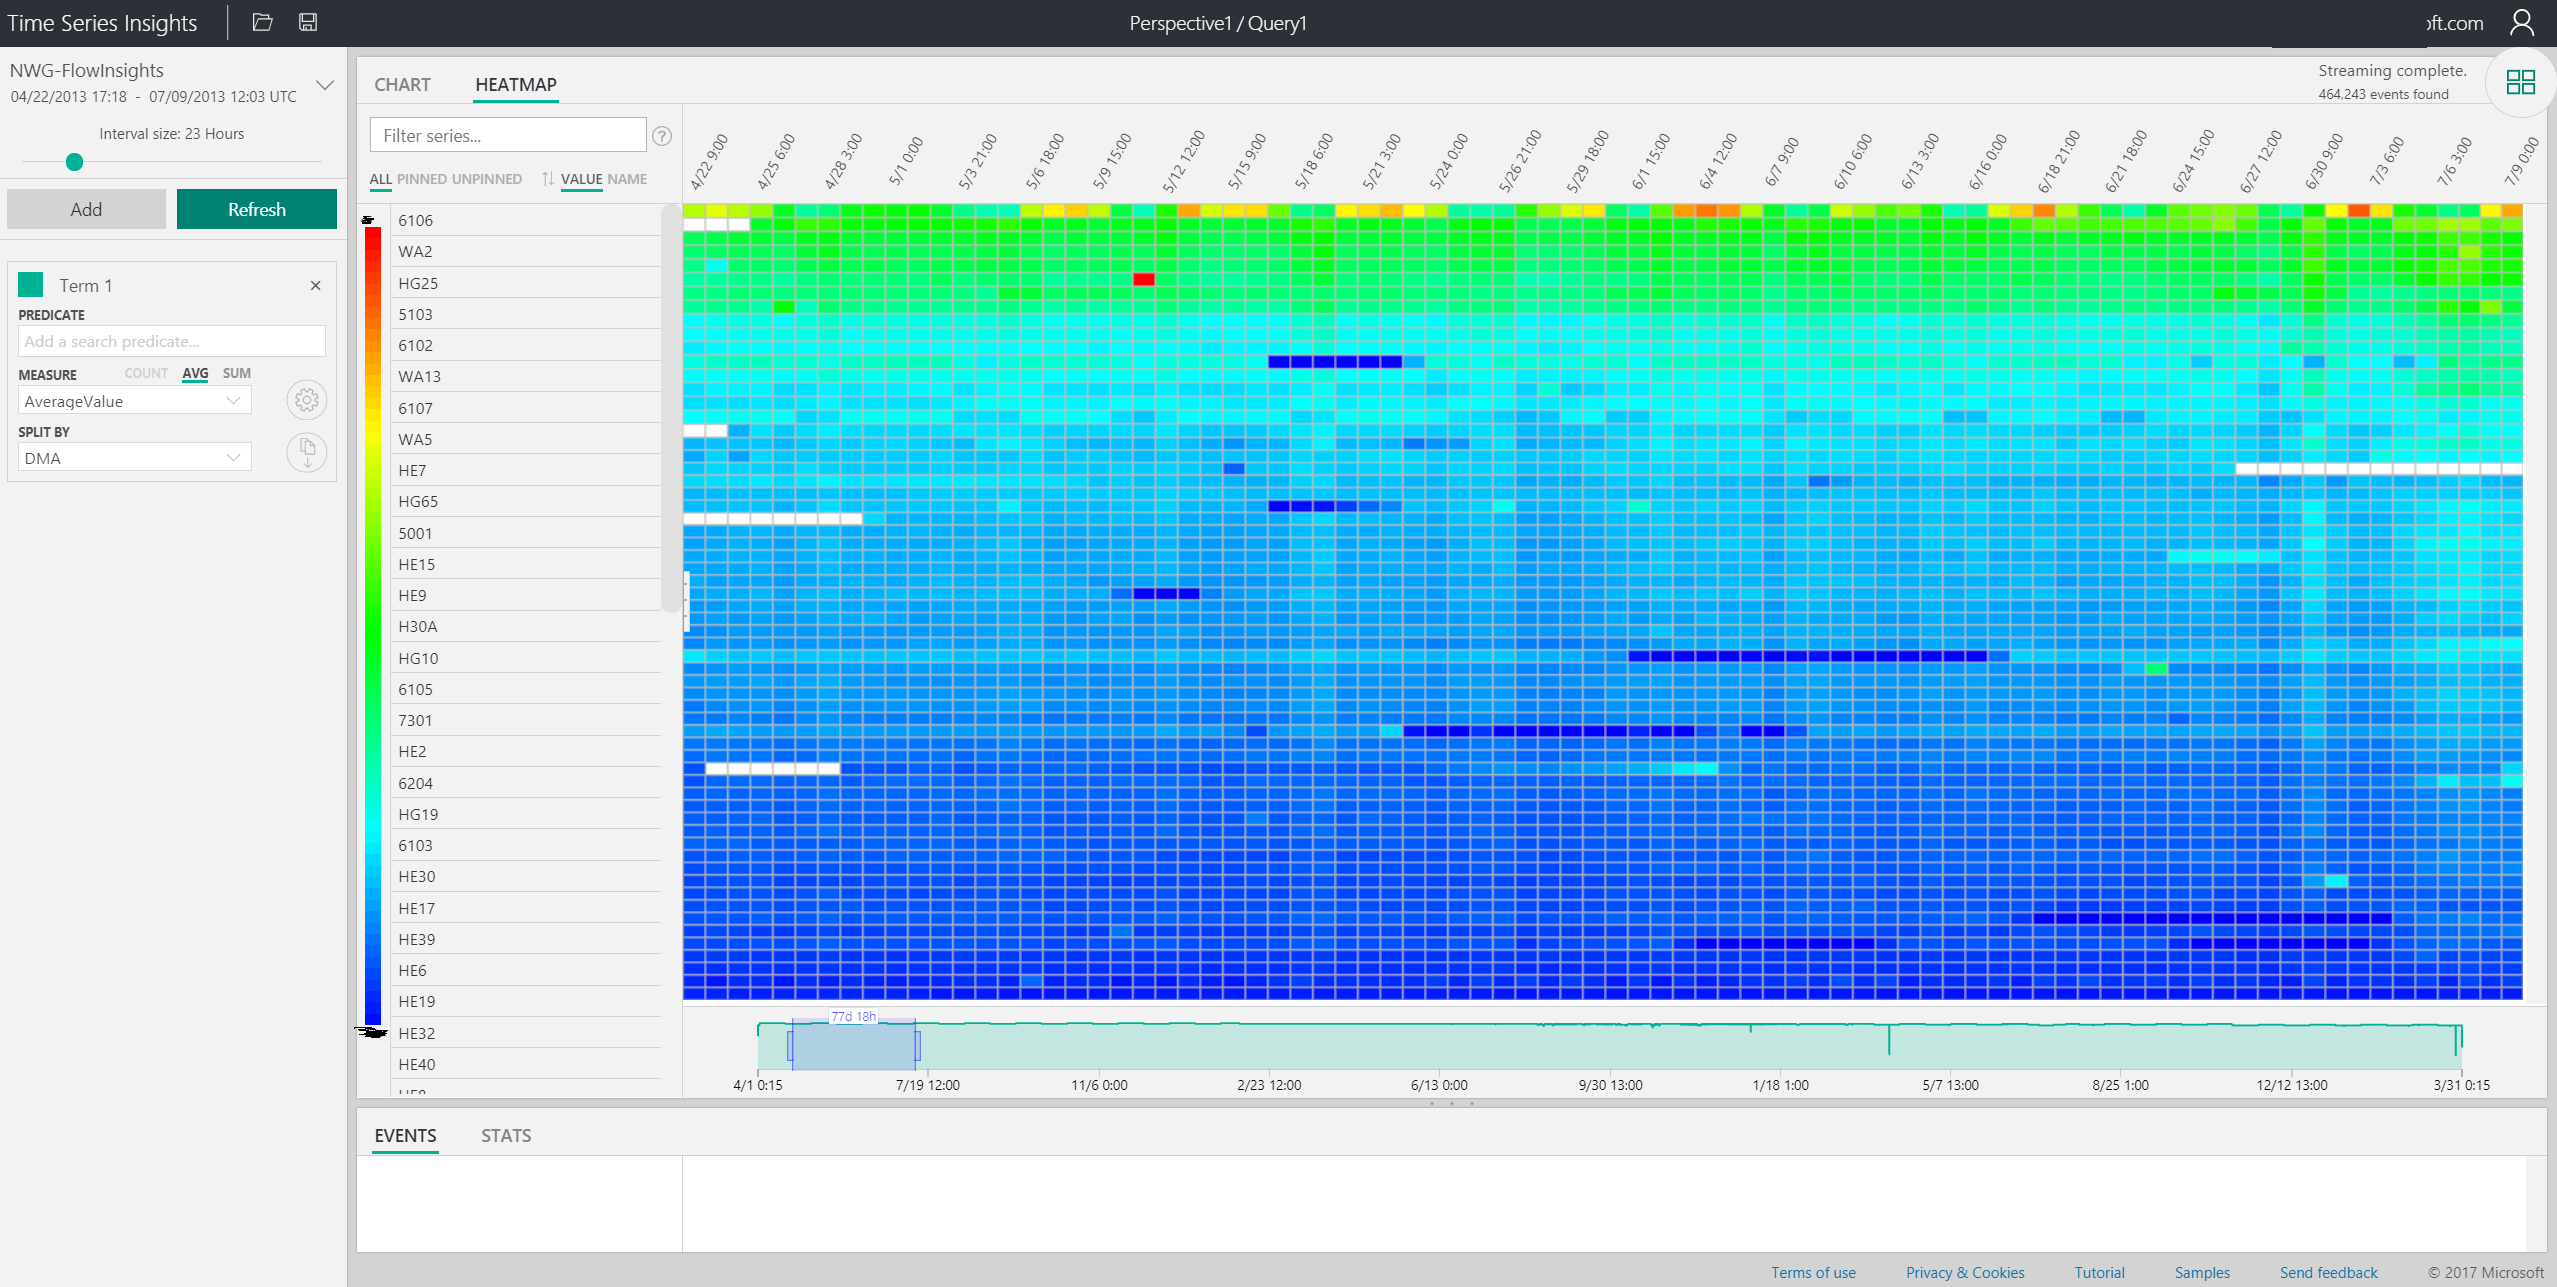
Looking at this, you can immediately discern some patterns, like water usage dropping over the weekends (or shifting slightly), and usage varying across DMAs. To be effective, you'd probably isolate DMAs with roughly the same usage, because Time Series figures out the range (heat) automatically based on min/max values. For me though, this was enough to prove that there are points where you could focus on.
Now, I'm not an expert in water leakage, so I was literally playing around with trying to spot anomalies. However, I did find some points where things seemed to point to a background leak (a slowly increasing flow), such as this:
I checked some of these anomalies with the team, and it turns out I was able to successfully spot (some) background leaks. So, yay me!
Conclusion
Just because I was able to, in a controlled environment, spot some patterns and they turned out to be leaks doesn't make this a 100% accurate tool, or make me an expert, but... it shows you the possibility. The tool is intended to quickly analyse large quantities of event data. Sometimes you can start spotting patterns, which means you can then focus efforts on building predictive models and start "training machines" to spot these patterns. That's even farther out of my league, so I didn't want to attempt that (yet, but who knows!).
If you want to get started, have a play with Time Series Insights here.
Update August 18th: The product team suggested I redirect the link to https://insights.timeseries.azure.com/demo, which goes through the basic functionality, and doesn't just load up the sample environment. Have a play! :)


